
COVID Dashboard

COVID 19 Summary View This is a useful summary of the steps used to create the data model for the Reports. SEE IT IN ACTION Step 1 – created a query to pull in the first data set. Created a parameter for a filename. Then changed the filename in the query to the parameter filename, and ensured that the query would dynamically […]
Power BI and Power Point

There is a lot of discussion about how well Microsoft Power BI and Microsoft Excel compliment each other, and they really do, but I also find that Microsoft Power BI and Microsoft Power Point are also better together. Power Point sometimes gets bad publicity but it is actually an amazing tool and in the right […]
Ensuring Column Names in Power Query Are Dynamic
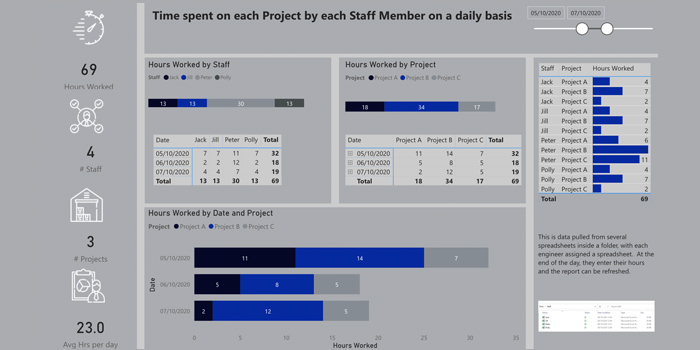
Challenge: To create a dynamic report that measures time spent on specific projects daily by many team members. Each team member is required to enter their hours at the end of each day. Report needs to be future proofed, eg, for the report to be flexible if more projects are added, the query has to […]
DAX Challenge Puzzle
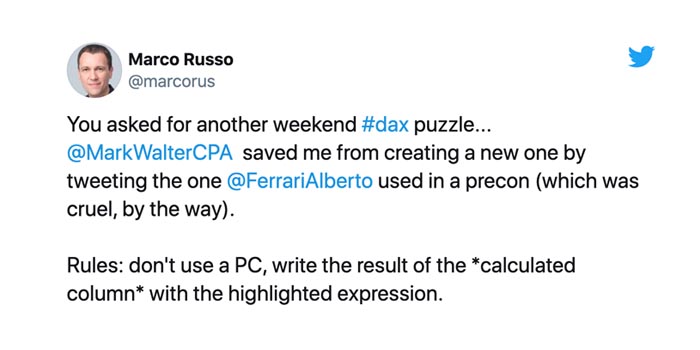
DAX Challenge which leads to so much more…. I understand the challenge and got the answer eventually, however I could not explain why, and it bothered me. Not being a natural programmer, I really have to understand the “why” so here is my explanation which hopefully is clear. Whilst thinking about it I came across this blog post (note the date […]
Microsoft Power Bi Dashboard – a report on Facebook Usage

So 21 Power BI MVPs bring out a book each contributing a chapter on different tips and techniques for using Power BI. The first chapter is how to use BI to analyse Facebook data and it seems rude not to have a play. I knew I was using Facebook a lot less, but having the […]
Microsoft Power BI – a quick way to ensure your client is happy with their dashboard

Client Satisfaction is critical to ensure that your dashboard works. I came across a genius idea whilst working through a masterclass in Power BI with the brilliant Chandoo which was very kindly hosted by Plum Solutions. The genius idea…. use a power point template to structure your dashboard. Why is this genius? It means that […]
Microsoft Excel Data Transformation Magic

Yesterday I received an SOS from a colleague… “Sue, I’m stuck! It says it can do it but it can’t…. and I’m running out of time. I have a deadline to meet and am seeing clients all day. Why won’t it work, help!!!” . So I did. The problem was that the HR software that […]
Microsoft Power Bi Dashboard – a sales dashboard example

So if you know me, you’ll know much I value and enjoy working with Excel, R, Python and Shiny. I love data and the power that it gives you to find out what is happening with your business. Therefore you may be surprised to learn that my allegiance is under threat…. Microsoft Power BI is […]
What is Data Analytics and why should I use it?

Data Analytics gives you the Business Intelligence that allows you to: Profit Maximisation Cost Reduction Customer Retention New Customer Development Focused and targeted marketing Customer Behaviour Evaluation of Product / Service Behaviour Informed decisions Data analytics is a process of inspecting, cleansing, transforming and modelling data to discover useful information, suggesting conclusions, and […]